Talay Daily Brief
The buffer is gone, tightening has begun
16 September 2026, Wednesday · Talay Insight editorial desk · 7 core sources
IExecutive summary and market impact
On 16 September the Fed raised rates for the first time since July 2023; the ECB had hiked a week earlier and the Bank of Japan is expected to hike on 18 September. The trigger is not monetary policy but physical supply: the Strait of Hormuz is closed, the Saudi East-West pipeline has been hit, the Houthis have seized the Bab el-Mandeb coast and, according to the IEA, OPEC+ spare capacity has fallen to 0.22 million barrels a day.
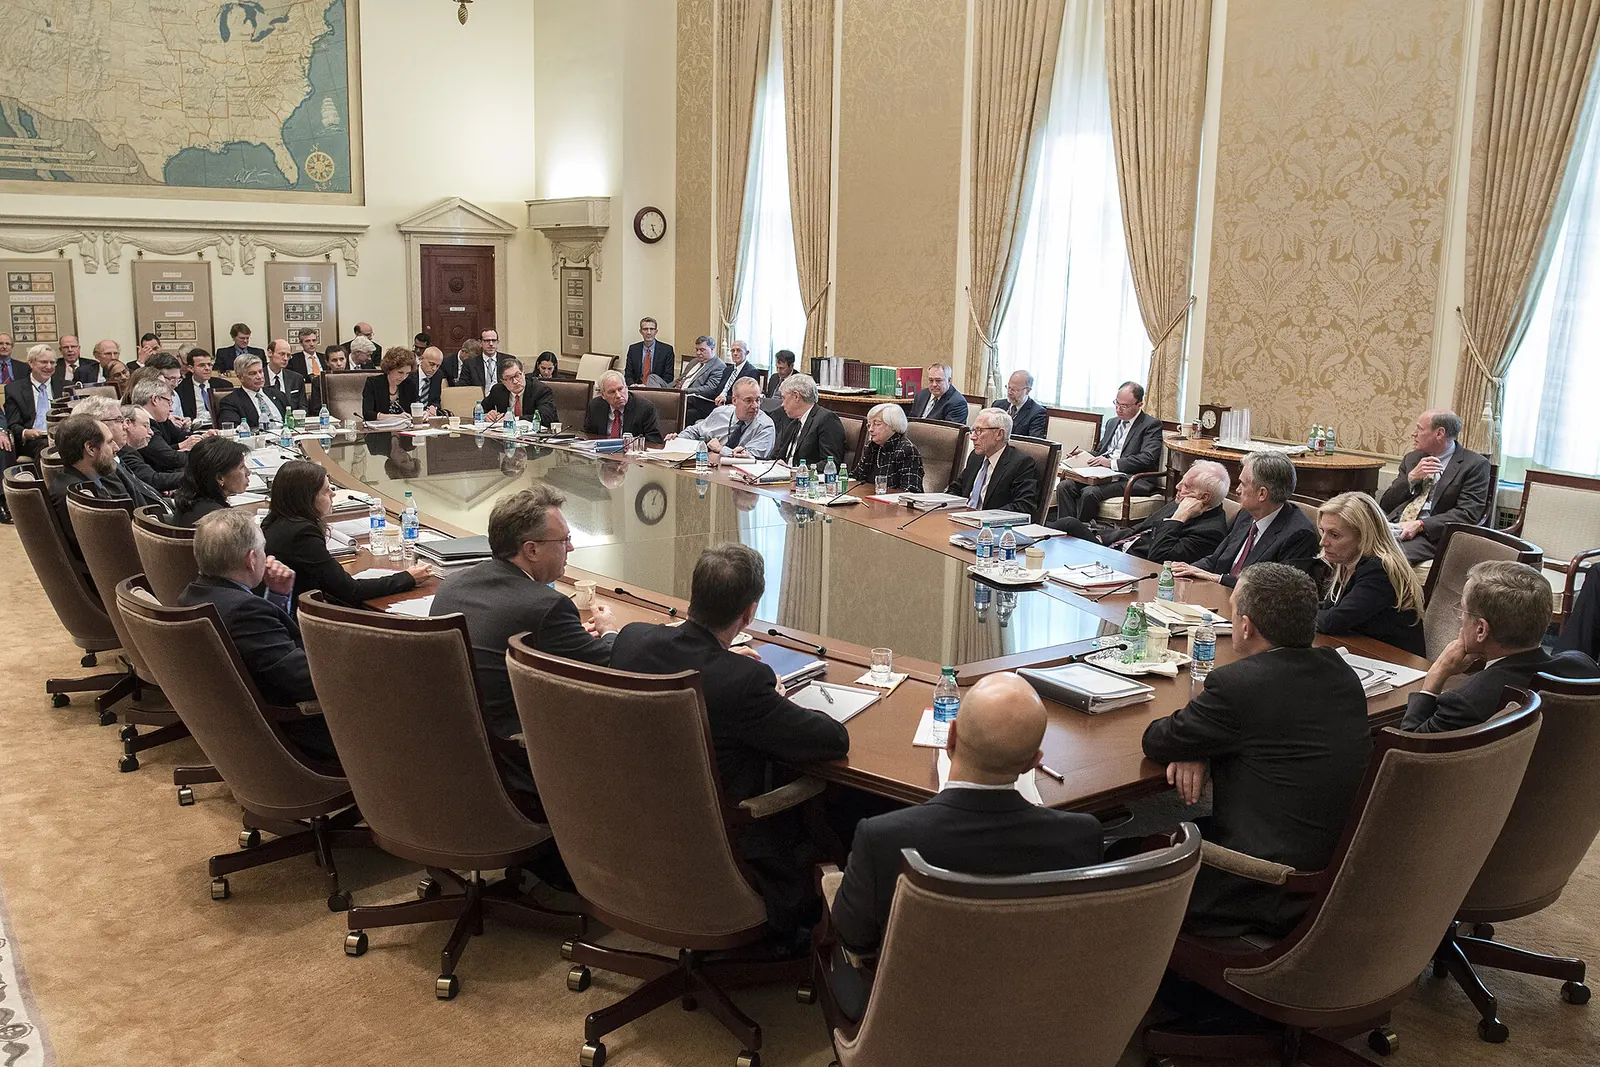
On 16 September the Federal Open Market Committee voted 12–0 to raise the federal funds target range from 3.50–3.75 per cent to 3.75–4.00 per cent. It is the first hike since July 2023 and the first tightening under Chair Kevin Warsh. In the September projections the median rate for end-2026 is 4.1 per cent, signalling one more hike before the year is out. The ECB raised its deposit rate to 2.50 per cent on 10 September. The Bank of Japan is expected on 18 September to lift its rate from 1.00 per cent to 1.25 per cent, the highest level since 1995.
The trigger is physical supply. According to the IEA's report of 11 September, 507 million barrels have been drawn from global stocks since February, OPEC+ produced about 7.27 million barrels a day below its targets in August, and effective spare capacity fell to 0.22 million barrels a day. In the same week drones launched from Iraq struck the Saudi East-West pipeline and the line was shut; on 10 September the Houthis seized Mocha and the islands of Perim and Hanish in Bab el-Mandeb. Tracking data for Hormuz show a total of 14 ships on 14 September. Diesel exceeded 200 dollars a barrel in early September.
The real analytical tension is this: in the US, August headline inflation rose to 3.4 per cent while core inflation eased to 2.4 per cent; most of the gap comes from energy. Five-year breakeven inflation was 2.41 per cent on 15 September. The market is largely pricing the shock as temporary, while central banks are acting as if it were persistent. With the Brent futures contract around 109 dollars on 15 September, the physical spot price exceeding 130 dollars reveals that today's squeeze is far more severe than the futures price suggests.
48-hour catalyst calendar
Time (TRT, UTC+3)Event and threshold to watch
- 17 Sep 14:30CBRT weekly reserve and securities statistics: whether the equity outflow has extended into a second week.
- 17 SepThe Fed's new interest rate on reserve balances (3.90%) and discount rate (4.00%) take effect.
- 17–18 SepBank of Japan meeting; expectation 1.25%. USDJPY at 155.30 on 16 September.
- 18 SepJapan's August national inflation data.
- 24 SepTrump–Xi meeting in Washington; extension of the truce ending on 10 November is on the agenda.
- 30 SepUS August PCE inflation.
- 4 OctOPEC+ meeting; October output was held steady on 6 September.
- 16 Oct · 22 OctS&P review of Türkiye's credit rating and CBRT Monetary Policy Committee.
- 31 DecExpiry of the Türkiye–Russia natural gas contracts.
Implications
- Central banks are responding to a supply shock beyond the reach of monetary policy by suppressing demand; long-term yields are in their highest zone since 2007.
- Both exit routes for Gulf exports came under pressure in the same week; the physical Brent spot price is about 20 dollars above futures.
- In Türkiye the real rate differential is narrowing of its own accord with global tightening; the 5-year CDS widened by about 13 basis points in two weeks.
·The day across five pillars
- Türkiye and Its Neighbourhood
The BIST 100 closed at 13,892 on 15 September, down 2.41%, and the banking index fell 4.15%. In the September Survey of Market Participants the year-end inflation expectation rose to 29.61%.
- Middle East and North Africa
The Iran–Gulf meeting planned in Salalah was postponed at Saudi request; Iran makes the temporary Hormuz corridor conditional on lifting the blockade.
- Europe
The France–Germany 10-year spread is at a one-year high of 95.6 basis points; the TTF gas price hit its highest level since December 2022.
- Asia-Pacific
In China exports rose 25% in August while retail sales slowed to 0.4%; Taiwan announced a record defence budget for 2027.
- South Asia
The BRICS New Delhi declaration, without naming the US, opposed unilateral tariffs and sanctions not authorised by the UN.
IIGeopolitical reality check
Developments that move prices and decisions are separated from those that take up headlines without changing behaviour; the mainstream narrative is then tested against hard data.
Module B
Signal vs Noise
SIGNAL 50% · NOISE 50%
- SIGNAL
Spare capacity at 0.22 million barrels a day
IEA September report: 507 million barrels of stock draws since February, 95 million barrels in August; there is no buffer for the next disruption.
Data: Brent crude oil ›IEA — Oil Market Report, September 2026
- SIGNAL
Risk in Bab el-Mandeb has turned into territorial control
On 10 September the Houthis took Mocha and the islands of Perim and Hanish; attack risk can be calmed through bargaining, control on land cannot.
- SIGNAL
The Fed signalled a further hike
In the September projections the median rate for end-2026 is 4.1%, one more hike above the current range.
Data: US 30-year yield ›Federal Reserve — September projections
- NOISE
OPEC+ quota decisions
October output was left unchanged on 6 September; with production about 7.27 million barrels a day below target, a quota change produces no physical supply.
- NOISE
Headlines that Hormuz is reopening
Iran makes the corridor conditional on lifting the blockade and the Salalah meeting was postponed; tracking data show 8–14 ships a day.
Data: Strait of Hormuz transits ›Al Jazeera — Temporary Hormuz solution deferred
- NOISE
Record reserve headlines
About 3.5 billion dollars of the weekly 3.95 billion dollar decline in gross reserves came from the gold price; the gross figure does not show FX capacity.
Narrative vs data
Narrative: Sanctions are cutting Russia's oil revenue and Russia is advancing in Ukraine.
Hard data: Urals, which had fallen to 34.52 dollars a barrel at Novorossiysk in December 2025, rose to 90.97 dollars on 6 March 2026; the Hormuz crisis increased demand for Russian oil. On 13 March the US granted a waiver allowing Russian oil waiting at sea to be purchased for 30 days (volume estimates 80–100 million barrels). According to CREA, Russia's fossil fuel export revenue was 604 million euros a day in August; the main cause of the latest fall in revenue is not sanctions but strikes on ports and refineries. On the front, according to ISW, Ukraine recaptured 129.81 km² in August while Russia advanced 90.35 km²; a year earlier Russia had taken 505.55 km².
Implication: Energy scarcity is making the sanctions regime's own enforcers loosen it; the main factor limiting Russian revenue is now strikes on the ground. The stalemate on the front does not mean escalation has eased but that the war has shifted to energy infrastructure.
The Moscow Times — Russian oil prices sink below 35 dollarsEuromaidan Press — Iran war, Brent and UralsCREA — August 2026 Russian fossil fuel exportsUA News — ISW August assessmentGlobal Trade Review — US waiver
IIIConstraints matrix
Not what leaders want, but what financial, legal, geographic and systemic constraints force them to do. Preferences are cheap; constraints bind.
Fed · Kevin WarshUS
Constraint · PCE inflation was 3.7% in July and headline CPI 3.4% in August. Long-term yields are at their 2007 peak, and the Treasury Borrowing Advisory Committee warned of a 1.45 trillion dollar financing gap for 2027–2028. The revision of July payrolls from minus 23,000 to plus 21,000 and a rise of 162,000 in August weakened the argument that the labour market is collapsing.
Behaviour it imposes · Suppressing demand in the face of a supply shock it cannot control and preventing a lasting rise in inflation expectations; hiking despite political pressure for easing.
Türkiye · CBRT and TreasuryTR
Constraint · Policy rate 37%, annual inflation 31.51%: a real rate of about 5.5 points. The 12-month current account deficit is 40.7 billion dollars; excluding gold and energy there is a surplus of about 4.97 billion dollars. About 62% of gross reserves are gold; sources are split between 53.4 and 53.6 billion dollars on net reserves excluding swaps. The survey expectation (29.61%) is above the Medium-Term Programme forecast (28.4%).
Behaviour it imposes · Unable to cut early on 22 October. Narrowing the real rate differential while global rates rise would put carry flows at risk; the room for manoeuvre lies in patience, not the exchange rate.
IranIR
Constraint · Since 14 July the US naval blockade has diverted more than 100 ships and largely halted its exports. Its strongest card is Hormuz itself: opening it costs bargaining power, keeping it closed costs its own export revenue.
Behaviour it imposes · Incremental bargaining without spending its leverage: agreeing a temporary corridor with Oman but making implementation conditional on lifting the blockade, while keeping up pressure on the ground through tanker attacks.
Saudi Arabia and OPEC+SA
Constraint · According to the IEA, effective spare capacity is 0.22 million barrels a day. The East-West pipeline that bypasses Hormuz was hit and shut around 11 September; the repair time is days according to the official statement and 5–6 weeks according to press sources. The Houthis are attacking Saudi cities.
Behaviour it imposes · Buying security rather than profiting from prices: the 14-member Multinational Maritime Defence Alliance founded on 30 July and the Mecca Joint Defence Agreement of 7 August are the institutional output of this.
ChinaCN
Constraint · Domestic demand is weak: retail sales at 0.4% in August, fixed asset investment −7.2% in January–August. By contrast, industrial output rose 5.2% and exports 25%, with a monthly trade surplus of 119.1 billion dollars. Producer prices rose 3.8% and the yuan stands at 6.71 against the dollar. The truce with the US ends on 10 November.
Behaviour it imposes · Continuing to export its surplus to the world and extending the truce. The rise in producer prices indicates that China has begun exporting price pressure rather than deflation to the world.
ECB and EuropeEU
Constraint · Euro area inflation was 3.3% in August and energy prices rose 14.3% year on year. EU gas storage stood at 68.04% on 13 September, about 16.6 points below the seasonal norm; TTF was at 81 €/MWh on 10 September. The France–Germany spread is 95.6 basis points.
Behaviour it imposes · Caught between inflation and financial stability: chasing a supply shock with rates while managing the widening borrowing costs of highly indebted members.
RussiaRU
Constraint · The economic constraint has eased but the physical constraint has tightened: according to CREA, product export revenue fell 32% in August and Novorossiysk loadings stopped for nine consecutive days. On the front it managed to advance 90.35 km² in August.
Behaviour it imposes · Offsetting what it cannot win on the front with strikes on energy infrastructure and deferring negotiation; high oil prices reduce the incentive to compromise.
What the matrix says
None of the seven actors prefers the current equilibrium, but none has the tools to change it alone. The Fed cannot bring energy prices down; Iran cannot open the strait without spending its leverage; Saudi Arabia cannot sell volume at high prices while its export routes are under attack; China must export its surplus because it cannot revive domestic demand; the ECB has to chase a supply shock with rates; Russia is less in need of compromise because of high prices; Türkiye cannot narrow its real rate differential. This equilibrium will be resolved not by the will of the parties but when a physical constraint such as pipeline, tanker or strait capacity eases. Diplomatic solution headlines are therefore looking for the system's real bottleneck in the wrong place.
Module A
Constraints Matrix
STRUCTURAL AVG 4.5 · TACTICAL AVG 3.3Structural constraints dominate: the outcome is set more by these limits than by the actors' preferences.
Hard structural constraintspersistent · beyond the actors' will
Spare capacity exhausted · Saudi Arabia
5/5According to the IEA, OPEC+ effective spare capacity is 0.22 million barrels a day; there is no output to cover a new disruption.
Geographic chokepoint · Iran
5/5The Hormuz and Red Sea exits for Gulf exports lie within range of the same adversary.
Long-term dollar rates · United States
4/5The US 10-year yield hit 5.04%, its 2007 peak; the global cost of financing is rising.
Türkiye's energy and gold dependence · Türkiye
4/5The current account deficit stems from energy and gold imports, and 62% of reserves are gold.
Tactical frictiontemporary · eases over time
Pipeline repair time weeks
4/5On the reopening of the East-West pipeline, the official statement says days, press sources say 5–6 weeks.
Diplomatic postponement days
3/5The Salalah meeting was postponed; the 24 September Trump–Xi summit will decide the fate of the truce.
Central bank calendar weeks
3/5The BoJ on 18 September, PCE on 30 September and the CBRT on 22 October are sources of near-term volatility.
IVBeyond the Atlantic view: blind spots
Points that Western analysis overlooks, attributed by author and institution. State media is flagged every time.
- 1
Prices holding at three digits is not resilience but the buffer being spent
Ken Koyama, IEEJ (Institute of Energy Economics, Japan) · 4 September 2026
Koyama describes the crisis as the largest supply disruption in the history of international energy markets. He writes that the price rise has been limited by pipelines, US exports, lower Chinese imports and stock draws, but that stock draws have markedly lowered global inventory levels and reduced flexibility against new shocks. While Western commentary looks at the price level, for Japan, which sources more than 90% of its crude from the Middle East, the real risk is the thinning buffer.
Note: The statement in early compilations that stocks have been exhausted is not in the source; the author says stocks have declined significantly.
eneken.ieej.or.jp - 2
The two straits are not separate files but a single lever
Khalid Al-Jaber, Middle East Council on Global Affairs · 13 September 2026
Al-Jaber argues that Iran uses Hormuz and Bab el-Mandeb as two ends of a single naval battlespace, while Washington treats them as separate fronts. According to the figures he cites, Hormuz flows fell from 20.9 million barrels a day in the first half of 2025 to 4.9 million in the second quarter of 2026, while Bab el-Mandeb flows rose from 4.2 million to 8.1 million barrels a day as Saudi exports shifted to the Red Sea. The Houthis now stand at the gate of a larger volume.
Note: The second-quarter 2026 flow figures are as reported by the author and could not be independently verified.
mecouncil.org - 3
The engine of the urge to exit the dollar is jurisdiction, not the exchange rate
Ivan Timofeev, Valdai Discussion Club · 15 September 2026
Timofeev examines the case in which Adani Enterprises reached a 275 million dollar settlement with the US Treasury over 32 transactions totalling 192.1 million dollars for Iranian-origin LPG. Even when a transaction takes place outside the US, US jurisdiction arises because the payment passes through an American correspondent bank. In the author's 2009–2026 sample, 105 of the 311 penalised firms are entirely non-US. While the Western debate looks at reserve shares, the urge to exit stems from payment infrastructure becoming a sanctions tool.
Note: Valdai is a Kremlin-aligned platform; the 311/105 sample is the author's own dataset. The Adani settlement dates from May 2026.
valdaiclub.com - 4
Asia is answering the crisis with the grid, not oil
Kaho Yu and Jinseok Sung, ISEAS – Yusof Ishak Institute (Fulcrum) · 2 September 2026
The authors recall that 95% of the Philippines' oil imports and 49% of Vietnam's gas imports come from the Middle East. Over 2025–2040 ASEAN needs investment of more than 300 billion dollars for grid expansion and about 27 billion dollars for regional interconnections; cross-border interconnection capacity is only 7.7 GW. Electrification reduces fuel volatility but shifts dependence from tankers to battery minerals, the clean technology supply chain and grid cyber security.
Note: The 300 billion dollars refers to total grid expansion; the cost of regional grid interconnections is about 27 billion dollars.
fulcrum.sg - 5
Middle East security architecture has shifted to a regional alliance, with Türkiye a founding member
Tunç Demirtaş, SETA · 3 September 2026
Demirtaş reads the Multinational Maritime Defence Alliance, founded in Riyadh on 30 July with 14 founding members, and the Mecca Joint Defence Agreement signed by Türkiye, Saudi Arabia and Pakistan on 7 August as the institutionalisation of the regional security network. He describes the US posture as selective retrenchment and sees the most likely model as a structure that is institutionally dense but selective on the ground. Türkiye's founding membership is almost entirely absent from Western reporting.
Note: SETA is a government-aligned think tank.
setav.org
VProbabilistic scenarios and asset-class implications
No firm forecasts are given. Percentages are calibrated judgement, not measurement. Competing explanations are set side by side.
H1Protracted siege
50%- Trigger
- Hormuz stays closed, the corridor is not implemented and the East-West pipeline stays shut for weeks; the Fed hikes once more by year-end.
- Impact
- Brent stays in a high band and the spot–futures spread stays wide; headline inflation sticks while core falls.
- Market transmission
- Long-term yields stay high; energy importers' currencies and Türkiye's risk premium remain under pressure; discounts in private credit may deepen.
H2Partial reopening
22%- Trigger
- The Iran–Oman corridor is implemented, the blockade is partly eased and the East-West pipeline reopens within days.
- Impact
- Transit numbers rise to dozens of ships and the spot price falls quickly towards futures.
- Market transmission
- Energy prices and tanker freight ease; breakeven inflation falls; energy importers such as Türkiye become the biggest relative winners.
H3Second shock
20%- Trigger
- Territorial control in Bab el-Mandeb feeds through to trade, or Saudi export infrastructure is attacked again.
- Impact
- With no spare capacity, the disruption passes straight through to prices.
- Market transmission
- Futures track spot; volatility and credit premia jump; Europe enters winter with low gas storage.
H4Financial accident
8%- Trigger
- The yen strengthens sharply on a Bank of Japan hike, and the unwinding of leveraged carry trades coincides with quarter-end funding pressure.
- Impact
- Indiscriminate liquidation takes place across risk assets.
- Market transmission
- Emerging market carry trades, including the Turkish lira, unwind rapidly; prices of illiquid assets fall sharply.
Percentages are calibrated judgements, not measurements.
Module C
Asset-Class and Positioning Implications
| Asset class | Exposure | Transmission channel | H1 | H2 | H3 | H4 | Expected | Conviction | Horizon | What to watch |
|---|---|---|---|---|---|---|---|---|---|---|
| Commodities | Crude oil and refined products | Exhausted spare capacity and attacks on export routes | ++ | −− | ++ | − | +0.88 | ●●● | 0–3 months | The spread between Brent spot and futures |
| Sovereign debt | Extended-maturity US yields | Term premium driven by inflation risk and the fiscal deficit | − | + | − | ++ | −0.32 | ●●● | 3–12 months | US 30-year yield |
| Credit | Türkiye external debt risk premium | Global rates, the energy bill and the credit rating calendar | − | ++ | −− | −− | −0.62 | ●●● | 0–3 months | 5-year CDS and the 16 October S&P decision |
| FX | Turkish lira and energy importers' currencies | Real rate differential and carry flows | − | + | −− | −− | −0.84 | ●●● | 0–3 months | Weekly foreign securities flows |
| Volatility | Global equity and rates volatility | Mismatch between low volatility pricing and the supply shock | + | − | ++ | ++ | +0.84 | ●●● | 0–3 months | VIX and the yen after the Japanese rate decision |
| Freight & insurance | Tanker freight and war risk premium | Longer routes and tanker attacks | ++ | −− | ++ | 0 | +0.96 | ●●● | 0–3 months | Hormuz and Suez transit numbers |
Annex 1Türkiye dashboard
IndicatorLatestReading
- Policy rate (1-week repo)
- 37.00%
- Held on 10 September; most sources call it the 5th hold of the year, one says the 6th
- CPI (August, y/y)
- 31.51%
- July 31.75%; monthly 1.84%
- Core C / Domestic PPI
- 30.07% / 27.95%
- Services inflation 40.28%; producer prices 2.57% m/m
- Net reserves excluding swaps
- $53.4–53.6bn
- Week of 4 September; sources conflict
- Gross reserves · gold share
- $184.2bn · 61.8%
- Weekly −$3.95bn; ~$3.5bn of the fall due to the gold price
- 5Y CDS
- 229.99 bps
- 15 September; 218.54 on 1 September, 217.3 on 31 August
- Current account (12-month)
- −$40.7bn
- July +$36mn; ~$4.97bn surplus excluding gold and energy
- Equity flows (week of 4 Sep)
- −$647.6mn
- Same week government domestic debt securities +$156.7mn
- USD/TRY · REER (Aug)
- 48.64 · 105.04
- 12-month-ahead expectation 58.60 (previous 57.43)
- Year-end CPI expectation
- 29.61%
- Medium-Term Programme forecast 28.4%; 24-month-ahead expectation 18.32%
- FX-protected deposits (KKM) balance
- 0
- Reached zero in the week of 21 August
- BIST 100
- 13,892
- 15 September close, −2.41%; banking −4.15%
Annex 2 · Reading recommendation
Crude Volatility: The History and the Future of Boom-Bust Oil Prices
Robert McNally · Columbia University Press (Center on Global Energy Policy Series), 2017 · cup.columbia.edu
Summary · It explains why oil prices have been chronically unstable since the Pennsylvania oilfields of the 1860s, and how that instability could be suppressed only in periods when a swing producer, first the Texas Railroad Commission and then Saudi Arabia, held spare capacity in the market. It argues that boom-bust cycles have returned as OPEC's influence has waned.
Why it matters · It helps read the IEA's figure of 0.22 million barrels a day of effective spare capacity not as a news item but as a regime diagnosis, and distinguish whether today's price squeeze stems from a temporary disruption or from the absence of a swing producer.
·Methodological transparency: what this issue does not know
Unverified items
- The current size of the six-month spread on the Brent futures curve; the claim that the December 2026 contract is about 40 dollars below May/June 2026 is inconsistent with the current curve
- Total foreign portfolio flows since the start of the year and the share of government domestic debt securities (the +6.33 billion dollars / 71.6% claim is not in the sources)
- The phrase economic strangulation attributed to Treasury Secretary Bessent
- The claim that Russia caused power cuts in five regions with 174 drones in a single night
- The current value of the MOVE index and the 630 billion dollar figure from hyperscaler 2026 capex forecasts
- The finding attributed to He Weiwen that China's global market share fell from 14.7% to 11.3%
- Details of an attempted Houthi drone attack near Mecca (single compilation source)
Conflicting sources (both reported)
- Hormuz flows: US Energy Secretary Wright says an average of 10 million barrels a day passed over the past week, while Reuters tracking shows 14 ships on 14 September and PortWatch data 8 transits on 13 September. Convoys under military escort not appearing in tracking may explain part of the gap.
- Brent: the futures contract was at 108.75–109.21 dollars on 15 September, while the physical spot series on FRED was at 130.80 dollars the same day. The two measures capture different things; both are reported.
- Net reserves excluding swaps: Dünya and Borsamatik give 53.4 billion dollars, while a Hibya report based on Gedik Yatırım gives 53.6 billion dollars.
- East-West pipeline attack: the date is given as 10, 11 or 12 September depending on the source; the perpetrator is variously reported as drones launched from Iraq or the Houthis.
- US effective tariff rate: Penn Wharton 6.7% (July, monthly), Tax Foundation 7.2% (2026 annual estimate); the two measures are not directly comparable.
Stale data warning
- The figure of 290 ships a week through Suez refers to the week of 24–30 August; September data could not be verified.
- The 26% median BDC NAV discount refers to the end of March 2026.
- The MOVE index value of 69.58 is dated 14 August.
- The Adani settlement dates from May 2026; it appears in the blind spots section because of the author's commentary.
Scenario percentages are calibrated judgements, not measurements. State media sources are flagged separately. This issue is for information only and is not investment advice. Production process and rules: methodology · source universe